

JSON 文件在线打开指南

在现代云原生架构中,API 网关的性能和安全性监控至关重要。Apache APISIX 作为高性能 API 网关,支持与 Prometheus 集成,以收集和监控 API 流量的关键指标。本文将详细介绍如何在 Apache APISIX 中配置和使用 Prometheus 进行监控,并探讨在监控过程中需要注意的事项。
Apache APISIX 是一个基于云原生的开源 API 网关,拥有负载均衡、动态上游、灰度发布、服务熔断等多种功能。通过其丰富的插件体系,APISIX 可以灵活地适应各种流量管理需求。Prometheus 是一款开源监控系统,提供时间序列数据的收集和存储功能,用户可以实时监控和分析系统性能。结合使用时,Prometheus 可以帮助捕捉到 API 流量的细粒度指标,提升系统的可观测性。
要在 Apache APISIX 中启用 Prometheus 指标,首先需要在 APISIX 中启用 Prometheus 插件。可以通过修改 config.yaml 文件实现:
plugins:
  - prometheus
在需要采集的服务和 API 上配置 Prometheus 插件,或直接配置为全局插件以便监控所有流量。
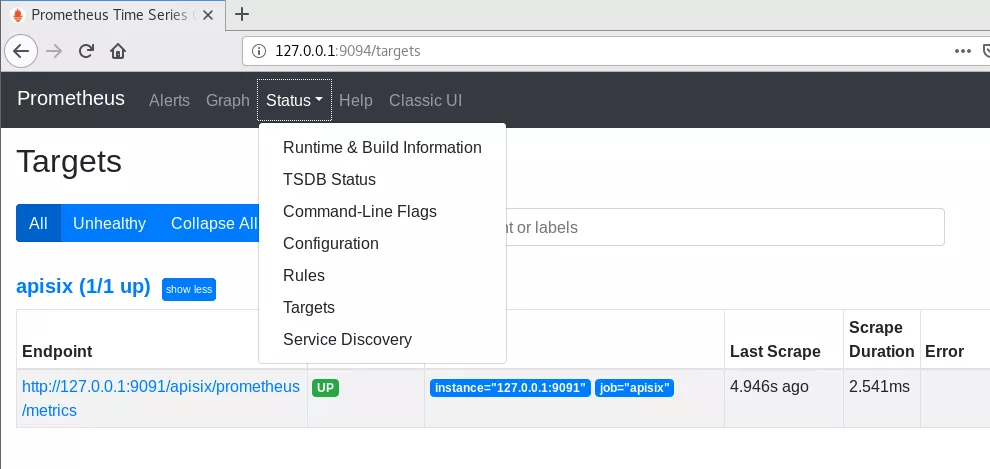
在 Prometheus 中,需要配置 prometheus.yml 文件来添加 APISIX 作为新的监控目标:
scrape_configs:
  - job_name: 'apisix'
    static_configs:
    - targets: [':']
确保 targets 指向 APISIX 的 Prometheus Exporter 地址。
apisix_http_request_total:记录通过 APISIX 的 HTTP 请求总数,观察系统流量。apisix_http_request_duration_seconds:HTTP 请求处理时间,识别性能瓶颈。apisix_http_request_size_bytes 和 apisix_http_response_size_bytes:分别监控请求和响应的数据大小。apisix_upstream_latency:上游服务的响应延迟。apisix_upstream_health:上游服务的健康状况。apisix_node_cpu_usage 和 apisix_node_memory_usage:分别监控 CPU 和内存使用情况。apisix_bandwidth:带宽使用情况。apisix_http_status_code:响应状态码分布,重要的是 4xx 和 5xx 错误。与 Prometheus 集成后,可以使用 Grafana 创建仪表板,实时可视化 APISIX 的性能指标。例如,一个仪表板可以展示 HTTP 请求总数和平均响应时间。
使用 Prometheus 的告警规则,可以在特定条件下触发告警。例如,当 apisix_http_request_duration_seconds 的平均值超过某个阈值时,发送告警通知:
alerting:
  alertmanagers:
    - static_configs:
      - targets:
        - localhost:9093
rules:
  - alert: HighRequestLatency
    expr: avg_over_time(apisix_http_request_duration_seconds[2m]) > 0.5
    for: 1m
    labels:
      severity: "critical"
    annotations:
summary: "High request latency on APISIX"虽然 Prometheus 提供的详细监控和告警功能增强了系统的可观测性,但也可能对系统资源造成压力。特别是拉取大量指标时,需要在监控需求与资源消耗之间找到平衡。Apache APISIX 从 3.0 版本起,通过独立进程优化了 Prometheus 插件,避免大量指标统计对业务流量的影响。
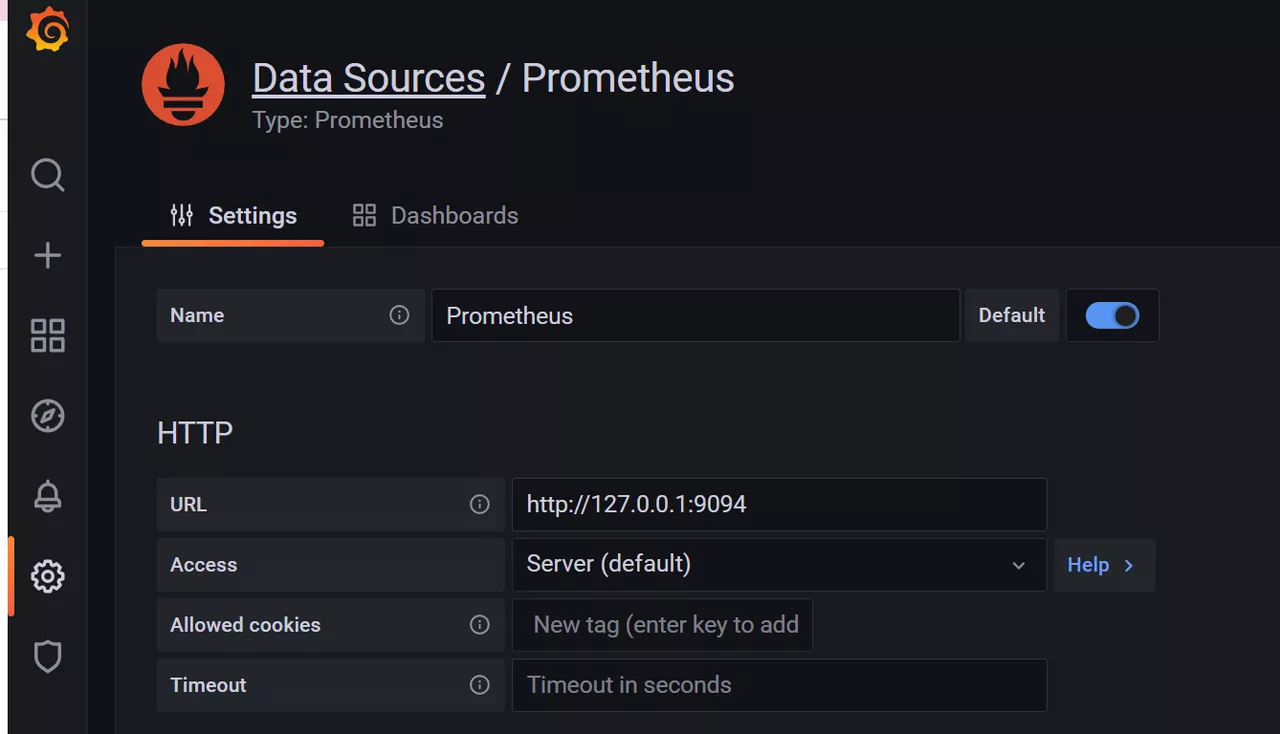
通过 Apache APISIX 与 Prometheus 的集成,企业可以更深入地了解其 API 基础设施,确保系统以高效和安全的方式运行。使用 Grafana 进行可视化和 Prometheus 进行告警配置,可以主动预防问题、优化性能,并保障系统安全。
答:您可以通过修改 config.yaml 文件,添加 prometheus 插件,然后在需要监控的 API 或服务上配置它。
答:在 prometheus.yml 文件中添加 APISIX 的 Prometheus Exporter 地址为监控目标,并设置合适的 scrape_interval。
答:Prometheus 提供实时数据采集和告警功能,而 Grafana 通过可视化仪表板展示这些数据,使得监控信息更加直观和易于理解。
答:可以通过合理设置 scrape_interval 和选择必要的指标,平衡监控需求与系统资源消耗。
答:HTTP 请求总数、响应时间、上游延迟和错误状态码分布是较为关键的指标,能帮助识别性能瓶颈和潜在问题。